Data visualization can be a confusing topic, especially with the existence of many other data jobs. Beginners often don’t know what role data visualization plays and how much demand there is for data visualization. Before you pick it as your career, there are a few critical things you need to know.
Data visualization is a good career, but there aren’t many jobs for making reports out of data because it’s not a field per se. It’s an excellent skill to have and is mostly used in other data jobs. You’ll need to know front-end development or data analysis to offer real value to the company.
In this article, we’ll discuss everything you need to know about data visualization. We’ll start by understanding what it is, and then we’ll talk about its pros and cons as a career choice.
Important Sidenote: We interviewed numerous data science professionals (data scientists, hiring managers, recruiters – you name it) and identified 6 proven steps to follow for becoming a data scientist. Read my article: ‘6 Proven Steps To Becoming a Data Scientist [Complete Guide] for in-depth findings and recommendations! – This is perhaps the most comprehensive article on the subject you will find on the internet!
Table of Contents
What Is Data Visualization?
We’re generating large amounts of data every day. According to Social Media Today, 2.5 quintillion bytes of data is created in a day. This incredible amount of information is difficult to capture, store, understand, and analyze with traditional programs.
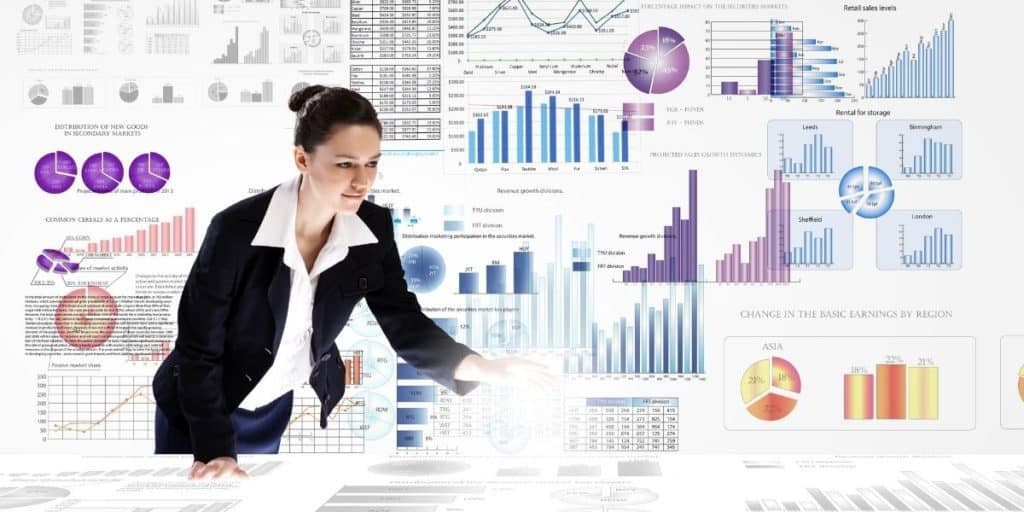
This is where data visualization comes into play. Data visualization is the representation of data in the form of graphs, charts, maps, and other visual elements. It helps you spot and understand patterns, trends, and outliers in raw data. When the way we make sense of information is changed, we are able to create value out of the data that was previously a burden.
For example, let’s say you have thousands of rows of data in an excel spreadsheet. How do you create a story to tell your boss out of this data? How do you explain it in an easy-to-understand and meaningful way? One way is to create a bar or pie chart using that data.
You’ll then have a visual representation that you can analyze and integrate into your business. This gives purpose and meaning to the heaps of raw data in your spreadsheet. Whenever you take raw data and transform it into infographics or even videos, you’ve performed data visualization.
Let’s come back to big data to understand the role of data visualization. When you have large amounts of data coming in from various sources, data engineers are tasked with collecting, storing, and optimizing the data to make it suitable for analysis.
Data analysts and data scientists may then analyze the data and create visual representations to understand it better. This is a crucial step of the data process as data scientists need to gain insights from the data to build machine learning models.
Is Data Visualization a Growing Field?
The age of big data is here. As more and more companies want to utilize the power of data, visualization is becoming an increasingly crucial tool. It allows data scientists and data analysts to make sense of the billions of rows of data generated every day. Professionals are able to tell a story by transforming a large volume of information into easy-to-understand visual representations.
There is no doubt that data visualization is a crucial phase of every company’s data strategy. As big data and machine learning become more important for businesses; data visualization is also bound to grow at the same rate.
Data scientist roles have already grown by over 650% since 2012, and the field is projected to grow at an unbelievable rate. Data visualization is also expected to grow similarly since the two are intimately connected.
Today, hundreds of companies want to hire skilled data scientists. I said ‘skilled’ because not everyone can perform data visualization. It’s not just about making a pretty graph or including a bunch of info on a graphic.
Effective data visualization is when you balance form and function. The data and the visuals must work together to produce an attractive and coherent representation, combining excellent analysis with exciting storytelling.
Data visualization requires you to master several tools and technologies such as Python, Tableau, D3.js, and SQL. I’ve discussed the skills needed for this position in a separate article. You can read the post on how hard data visualization is to learn more about it.
Is Data Visualization a Good Career Choice?
Data visualization skills are undoubtedly critical for the success of every data process. However, there’s something fundamental you need to know about data visualization before you make it your end goal.
Although data visualization is an excellent career choice, there aren’t many openings specifically for the position of data visualization engineer. Many experts believe that there is no such thing as a dedicated data visualization position in the industry. They believe that data visualization is just a tool at the end of a long process performed by data analysts, scientists, and engineers.
Data visualization as a profession currently does not have clear paths for growth. So ambitious people who want to progress in their jobs feel forced to move to other roles like data science, data engineering, data analysis, etc. You’ll find success stories for all other data jobs, but hardly any for data visualization.
Don’t get me wrong; you can certainly find several job listings looking for ‘data visualization engineers.’ But don’t expect to only build charts and graphs out of already optimized and analyzed datasets. Companies don’t leave much room for technical innovation when it comes to data visualization.
If you’re only making simple pie charts and bar graphs a few hours a week, you have more than enough time to work on other crucial parts of the project. You can build data APIs, handle data storage, analyze existing data, and many other things except the visual representation of data through graphics.
The bottom line is that focusing on data visualization as a career is probably not the best idea. Instead, you should master data visualization skills and focus on building other data-related expertise like data science or data analysis. You may specialize in data visualization, but it should just be one tool in your data skills repertoire.
How Do Data Visualization Skills Help Your Career?
We’ve already discussed that data visualization is a crucial part of the data process. Without it, we would have a difficult time making sense of terabytes of raw data. But even though data visualization is an essential skill for data professionals, many people don’t consider it a profession in itself. There aren’t many jobs for data visualization specialists either.
However, this doesn’t mean you can get away with not learning it. Knowing how to convert raw data into compact, meaningful visuals requires great skill as it’s not just about slapping the “info” on infographics. You also have to know what kind of tools to use and what you need to answer using the data.

If you’re a data professional, sharpening your data visualization skills can undoubtedly give your career a boost. It makes you a more valuable team member as you’re able to tell stories and gain insights from heaps of information. It also makes it easier for everyone to do their jobs more effectively.
Author’s Recommendations: Top Data Science Resources To Consider
Before concluding this article, I wanted to share few top data science resources that I have personally vetted for you. I am confident that you can greatly benefit in your data science journey by considering one or more of these resources.
- DataCamp: If you are a beginner focused towards building the foundational skills in data science, there is no better platform than DataCamp. Under one membership umbrella, DataCamp gives you access to 335+ data science courses. There is absolutely no other platform that comes anywhere close to this. Hence, if building foundational data science skills is your goal: Click Here to Sign Up For DataCamp Today!
- IBM Data Science Professional Certificate: If you are looking for a data science credential that has strong industry recognition but does not involve too heavy of an effort: Click Here To Enroll Into The IBM Data Science Professional Certificate Program Today! (To learn more: Check out my full review of this certificate program here)
- MITx MicroMasters Program in Data Science: If you are at a more advanced stage in your data science journey and looking to take your skills to the next level, there is no Non-Degree program better than MIT MicroMasters. Click Here To Enroll Into The MIT MicroMasters Program Today! (To learn more: Check out my full review of the MIT MicroMasters program here)
- Roadmap To Becoming a Data Scientist: If you have decided to become a data science professional but not fully sure how to get started: read my article – 6 Proven Ways To Becoming a Data Scientist. In this article, I share my findings from interviewing 100+ data science professionals at top companies (including – Google, Meta, Amazon, etc.) and give you a full roadmap to becoming a data scientist.
Conclusion
Data visualization is a crucial part of the data process. It allows you to transform raw information into meaningful graphs, charts, and maps.
However, you’ll often find data visualization to be a subset of other data jobs like data analysis or data science. This is because data visualization is usually not considered a field itself. Other professionals are typically expected to have data visualization skills. So there’s not much need for specialists in this area.
This is not to say you can’t land a job as a data visualization engineer. Just keep in mind that there aren’t many available positions.
BEFORE YOU GO: Don’t forget to check out my latest article – 6 Proven Steps To Becoming a Data Scientist [Complete Guide]. We interviewed numerous data science professionals (data scientists, hiring managers, recruiters – you name it) and created this comprehensive guide to help you land that perfect data science job.
Affiliate Disclosure: We participate in several affiliate programs and may be compensated if you make a purchase using our referral link, at no additional cost to you. You can, however, trust the integrity of our recommendation. Affiliate programs exist even for products that we are not recommending. We only choose to recommend you the products that we actually believe in.
Recent Posts
Data science has been a buzzword in recent years, and with the rapid advancements in artificial intelligence (AI) technologies, many wonder if data science as a field will be replaced by AI. As you...
In the world of technology, there's always something new and exciting grabbing our attention. Data science and analytics, in particular, have exploded onto the scene, with many professionals flocking...