With so many “data x” jobs available, it’s hard to figure out the differences between them. Data visualization is a field that’s not discussed as often as data engineering and others. So let me introduce you to data visualization by discussing if it’s an easy or hard position.
Data visualization is hard. It requires you to be skilled in programming languages like Python, Angular JS, D3.js, and SQL. Besides technical expertise, you also need to know mathematical and statistical concepts like linear algebra, calculus, probability theory, regression, etc.
In this article, we’ll look at what data visualization is and the skills required for it. We’ll also discuss why studying only for data visualization may not be the best idea.
Important Sidenote: We interviewed numerous data science professionals (data scientists, hiring managers, recruiters – you name it) and identified 6 proven steps to follow for becoming a data scientist. Read my article: ‘6 Proven Steps To Becoming a Data Scientist [Complete Guide] for in-depth findings and recommendations! – This is perhaps the most comprehensive article on the subject you will find on the internet!
Table of Contents
What Is Data Visualization?
Understanding data visualization will help you better understand the job and what to expect from it. So let’s look at what this job is and what these professionals do.

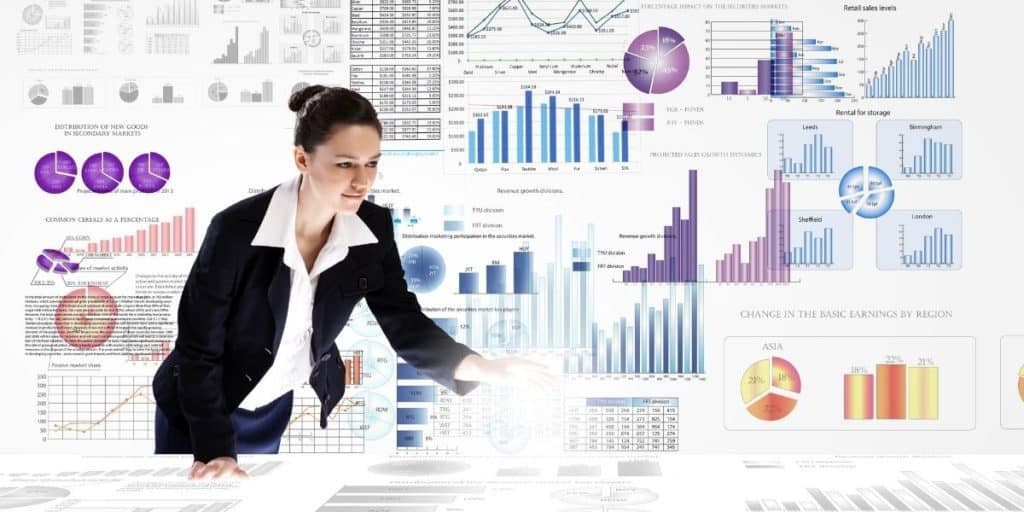
Data visualization is the representation of information or data in the form of graphs, charts, or visual formats. It is essentially the process of communicating data with the help of images.
We’re generating large amounts of data every day. With the rise of big data, visualization has become an indispensable tool. Data visualization is an integral part of any business’s data strategy because it allows you to spot trends, outliers, and patterns more easily.
Skills Required for Data Visualization
Now that you know what data visualization is, it’s time to discuss what skills you need to land a job in this field. As we’ve discussed, it’s a technical field that requires you to have an in-depth knowledge of coding, database management, mathematics, and statistics. Apart from tech skills, you also need to have soft skills like communication and presentation skills.
Here’s what you need to know to become a data visualization specialist:
Programming Languages
Programming knowledge is essential not just for data visualization but for any job in the data industry. Ever since big data became a thing, Python quickly became the standard language for all things data. So Python is the number one priority for aspirants wanting to become data visualization specialists.
Apart from Python, R is a programming language used extensively for data visualization. And D3.js is a JavaScript library that produces dynamic, interactive data visualizations with HTML, CSS, and SVG on web browsers. Programming is a core part of data visualization, and the professionals working in this field must have strong coding skills.
Mathematics and Statistics
To turn information into useful graphical formats, data visualization specialists need to understand the data first. They should have in-depth knowledge of mathematical concepts such as calculus and linear algebra and statistical concepts such as probability theory, statistical significance, and hypothesis testing.
You don’t have to pursue a Ph.D. in Mathematics or Statistics. There are books and online courses on platforms like Coursera that can help you learn the essentials. Here is the Mathematics for Data Science specialization course by Coursera. Similarly, for statistics, Think Stats and Think Bayes are two excellent books to start your statistics journey.
Database Management
Database management is another crucial aspect of data visualization. Data visualization specialists must know how to query and extract data from relational databases. SQL is the standard language for all such purposes, which means they need to have excellent command over the SQL language.
Nowadays, these professionals also encounter big data a lot. So knowing how to handle NoSQL databases like MongoDB has also become necessary. Data visualization specialists should know how to access and extract information from databases. So data management is just as important as other skills required for this position.
Communication Skills
Data visualization specialists may create graphs, charts, maps, etc., with the help of programming languages. Then, they have to present their visualizations to stakeholders through presentations. This is because the entire point of data visualization is to help people better understand the insights and data gathered by data engineers and data scientists.
So it’s no surprise that data visualization specialists need to have excellent communication and presentation skills. Data visualization can help us understand information faster, and it can also be used to communicate emotions. Lastly, it also allows us to create a shared understanding, which is why communication skills are crucial for data visualization.
How Hard Is It To Become a Data Visualization Specialist?
We’ve discussed what data visualization is and the skills required for it. You may have already gotten an idea of its difficulty. But if you haven’t, let me break it down for you.
Data visualization requires you to learn programming languages such as Python, R, and SQL. These can take anywhere from 4-8 months, depending on your time allotted for study and consistency. Then, you need to learn mathematics and statistics, which can take another 4-8 months. Lastly, you also have to create relevant projects to build a portfolio. That can take another two months.
So learning data visualization will take at least a year or a year and a half. For you, it can even be around two years if you’re a complete beginner. There’s no need to be discouraged if you’re taking more time. It’s essential to learn at your own pace and master subjects before moving on.
Overall, it’s not a piece of cake. You’ll have to work hard to acquire the necessary skills and land a job. But it can undoubtedly be done with perseverance.
By the way, I’ve discussed the difficulty of data engineering in a separate article. You can read it here: Is Data Engineering Easy? Or, Is It Hard?
Data Visualization Skills Are Often a Part of Another Data Job
This is an important section of the article, and you shouldn’t miss it. The thing is, you will not find many job listings for data visualization engineers/specialists/analysts/researchers. This is because data visualization is often a subset of certain data scientist and data analyst roles. It is undoubtedly an important skill, but jobs requiring data visualization skills are usually focused more broadly on data science or other data-related jobs.

I’m not saying data visualization jobs don’t exist; they certainly do. However, not many companies are willing to spend money to hire a data visualization expert when they can get the same skills from another data role.
For example, you will often see data visualization listed as a skill requirement for data scientist and data analyst positions. These professionals indeed benefit from having data visualization skills. Still, they also spend much of their time manipulating and managing data directly.
Don’t get me wrong; you may certainly be able to land a job as a data visualization specialist. But its demand is less than that of data analysts, data scientists, etc. So data visualization cannot be compared to other data jobs. And it would be better to prepare for other data jobs that encompass data visualization than studying for data visualization alone.
Author’s Recommendations: Top Data Science Resources To Consider
Before concluding this article, I wanted to share few top data science resources that I have personally vetted for you. I am confident that you can greatly benefit in your data science journey by considering one or more of these resources.
- DataCamp: If you are a beginner focused towards building the foundational skills in data science, there is no better platform than DataCamp. Under one membership umbrella, DataCamp gives you access to 335+ data science courses. There is absolutely no other platform that comes anywhere close to this. Hence, if building foundational data science skills is your goal: Click Here to Sign Up For DataCamp Today!
- IBM Data Science Professional Certificate: If you are looking for a data science credential that has strong industry recognition but does not involve too heavy of an effort: Click Here To Enroll Into The IBM Data Science Professional Certificate Program Today! (To learn more: Check out my full review of this certificate program here)
- MITx MicroMasters Program in Data Science: If you are at a more advanced stage in your data science journey and looking to take your skills to the next level, there is no Non-Degree program better than MIT MicroMasters. Click Here To Enroll Into The MIT MicroMasters Program Today! (To learn more: Check out my full review of the MIT MicroMasters program here)
- Roadmap To Becoming a Data Scientist: If you have decided to become a data science professional but not fully sure how to get started: read my article – 6 Proven Ways To Becoming a Data Scientist. In this article, I share my findings from interviewing 100+ data science professionals at top companies (including – Google, Meta, Amazon, etc.) and give you a full roadmap to becoming a data scientist.
Conclusion
Data visualization is not an easy job, but you can certainly become a data visualization specialist with dedication and persistence. However, data visualization is often a subset of other data jobs like data analysis and data science. You will not find many jobs specifically for data visualization.
Data visualization requires you to have excellent technical skills and know programming languages along with their libraries and packages. Mathematics and statistical concepts are also essential for data visualization. Lastly, job seekers must also have communication skills and learn how to handle database management systems.
BEFORE YOU GO: Don’t forget to check out my latest article – 6 Proven Steps To Becoming a Data Scientist [Complete Guide]. We interviewed numerous data science professionals (data scientists, hiring managers, recruiters – you name it) and created this comprehensive guide to help you land that perfect data science job.
Affiliate Disclosure: We participate in several affiliate programs and may be compensated if you make a purchase using our referral link, at no additional cost to you. You can, however, trust the integrity of our recommendation. Affiliate programs exist even for products that we are not recommending. We only choose to recommend you the products that we actually believe in.
Recent Posts
Data science has been a buzzword in recent years, and with the rapid advancements in artificial intelligence (AI) technologies, many wonder if data science as a field will be replaced by AI. As you...
In the world of technology, there's always something new and exciting grabbing our attention. Data science and analytics, in particular, have exploded onto the scene, with many professionals flocking...
