Business analysts play a vital role in a company’s decision-making process. One major part of their job is presenting data findings to key executives. Luckily, there are products out there, like Tableau, that make the analyst’s job so much easier.
Tableau is useful for business analysts because it streamlines data visualization. The tool has a shallow learning curve, which makes training new team members a breeze. Secondly, Tableau is easy to use and works fast. Lastly, its visualizations are colorful and easy to understand.
Read on to learn about Tableau’s role in business intelligence.
Important Sidenote: We interviewed numerous data science professionals (data scientists, hiring managers, recruiters – you name it) and identified 6 proven steps to follow for becoming a data scientist. Read my article: ‘6 Proven Steps To Becoming a Data Scientist [Complete Guide] for in-depth findings and recommendations! – This is perhaps the most comprehensive article on the subject you will find on the internet!
Table of Contents
Breaking Down Business Intelligence
Business intelligence today is quite different from the traditional business intelligence of the past. In the 1960s, business intelligence was a buzzword used to describe information sharing systems among organizations. As computer technology evolved by the 1980s, computer modeling became an integral part of using data to drive business decisions. Today self-service programs, like Tableau, provide data insights practically on-the-fly.
The Life Cycle of Data Analysis
Business intelligence is the use of data analysis to make informed business decisions. Robust business intelligence can drive change in any company, eliminate deficiencies, and adapt to market changes. However, it takes a wide range of tasks to gather sufficient business intelligence. How does it all connect? The professional term for this process is the ‘cycle of analytics.’
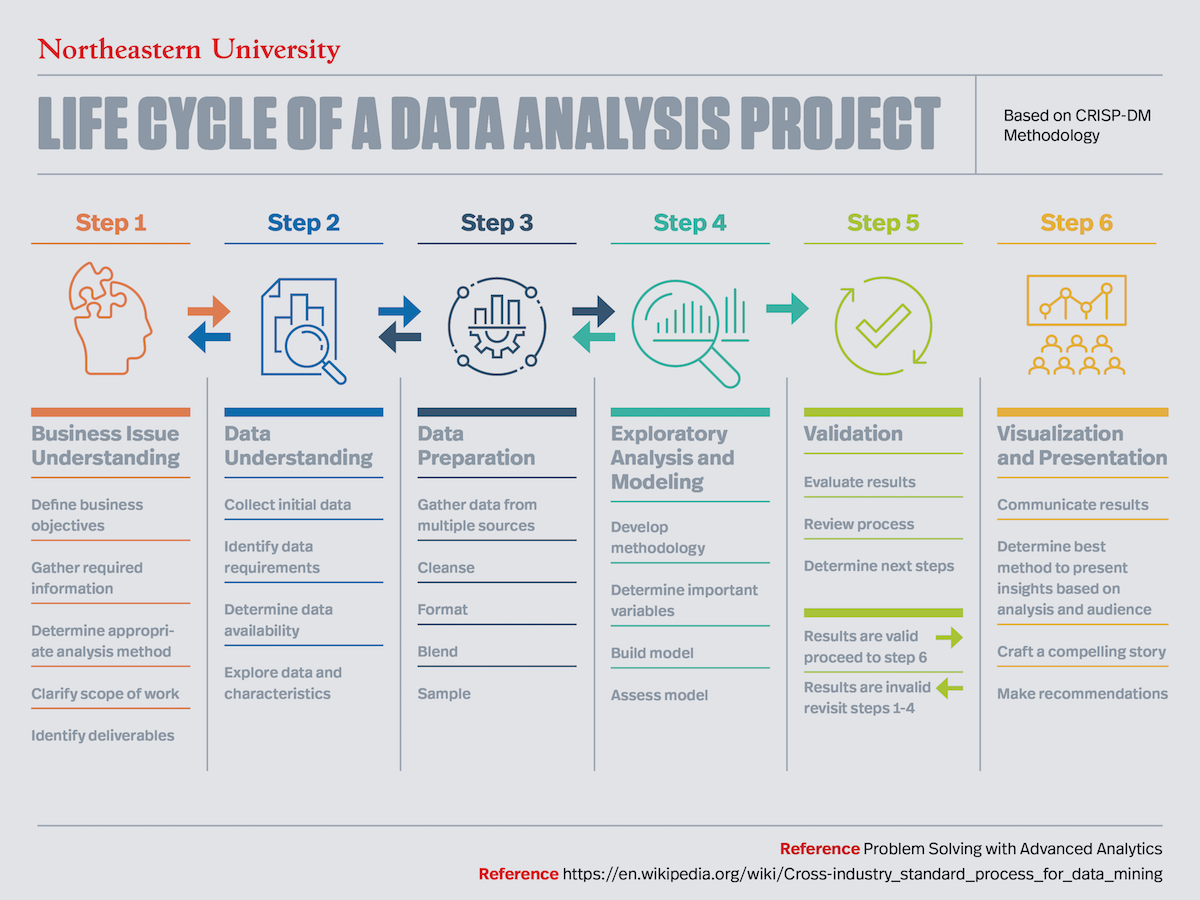
Understanding Business Issues
When encountering a new project, data analysts need to learn as much as they can about what their employer wishes to learn from the data. This step is when questions get asked, objectives get set, and the analyst works with their team members and stakeholders to determine the study’s size and scope. Think of this as the data scientist’s mission briefing.
Understanding the Data Set
A data analyst’s data set should be as clean and straightforward as possible. In this step, analysts organize their data by specified variables and check it for error. There are plenty of tools that can accomplish this task. For instance, Tableau Prep and Tableau Desktop are capable of organizing data. However, R, Python, and Alteryx can also get the job done.
Preparing the Data
In this stage, the data must get combed through once again. This time, the data analyst ties up any loose ends or missing variables from the data while avoiding any tampering. This step’s tasks include organizing unclear data into concise categories, eliminating any replicate data, and replacing missing variables with average data scores.
Exploratory Analysis and Modeling
The search for answers begins with this step. Data analysts set up models to test the data in pursuit of their objectives. These mathematical representations help analysts find relationships among their data as well as assist their predictions. Analysts will use models like linear regressions, decision trees, and random forest modeling, for instance.
Validating the Data
Analysis and Modelling provide data scientists with their initial discoveries. However, these insights must hold their merit against vigorous testing. In this step, analysts check that their models work correctly, their data is clean, and that their findings answer the question asked in the first step. Validating data invokes a lot of trial and error in pursuit of the most accurate results possible.
Visualizing and Presenting Findings
This final step is possibly the most crucial. After the deliverable, or the answer to the company’s initial query, gets determined, the analyst must present their findings. Analysts compile visuals that interpret the data in ways the rest of the company can understand. A robust data visualization tells a story about where the company has been and where it is going.
However, the analyst’s journey does not end with the presentation of their findings. As new questions get asked and more data becomes available, the analyst will go back and forth between these steps. That is why this process is cyclical rather than linear.
Jobs in Business Intelligence
As you can see, a lot of work goes into gathering data insights for a business. That is why the business intelligence field includes various professions. Some BI jobs cover the analysis side of things, while others focus on what actions to take based on the insights discovered. Take a look below:
Business Analyst
Making business decisions based on data-driven evidence is always a smart move. However, making a decision and putting that decision into action are two different tasks. Business analysts bridge the gap between businesses and IT to interpret these decisions’ consequences and make the most profit.
Business Intelligence Analyst
Contrary to business analysts, who focus on increasing profit, BI analysts find areas that need improvement to decrease loss. This multidisciplinary job requires a combination of IT, communication, and problem-solving skills. BI analysts need to mine through a lot of data and compare the various trends among their findings. Then they use this information to guide decision making.
Business Intelligence Developer
Business Intelligence is a multi-layered system with multiple interfaces. In the storage layer, unstructured data sits in its rawest state. This data gets organized in the warehouse layer. Finally, the findings from this data get visualized in the reporting layer. A BI developer develops, deploys, and maintains the various Business Intelligence interfaces, ensuring these tools work correctly.
Business Intelligence Manager
Every team needs a leader, including business intelligence groups. A business intelligence manager supervises, trains, and directs a data analysis team to pursue data-driven assessment and risk analysis. A BI manager prepares reports based on their group’s findings and presents them to other company teams’ key executives.
How Does Tableau Work?
Tableau emerged in the data analytics scene in 2003 and has grown in popularity ever since. The program is a mainstay of data visualization and even expanded to the macOS in 2014. So what is it about Tableau that makes it so popular?
Tableau provides beautiful and intuitive data visualizations without requiring any programming from the stop-user. The program’s engine, an offshoot programming language of Structured Query Language called VizQL, accepts data formulae and outputs it as graphs, charts, tables, and other visualizations. Compared to other programs, like R Shiny, Tableaus drag-and-drop and point-and-click features cut down developing time.

Why Tableau is Useful for Business Analyst?
Tableau is very useful for a business analyst. There are numerous benefits to this product. However, its three most significant assets are its shallow learning curve, ease of use, and gorgeous visualizations:
- Learning curve: Since Tableau is not a programming language, it does not require nearly as much training to use. The shortened training period makes the integration of new analysts that much easier.
- Ease of use: Tableau does not require code to use. Furthermore, the program operates via drag-and-drop and point-and-click functions. The user needs a base knowledge of their data to input it correctly. However, once Tableau receives the data, it creates visualizations with no additional effort from the user. What’s better, Tableau can handle other parts of the data analysis, like data preparation.
- Fantastic visualizations: Data visualization is vital in business intelligence. It is the analyst’s job to tell a straightforward story to the key executives of the company. However, this information has to be easily digestible by those unfamiliar with data science. Luckily, Tableau creates visualizations that are easy to follow and interactive.
Author’s Recommendations: Top Data Science Resources To Consider
Before concluding this article, I wanted to share few top data science resources that I have personally vetted for you. I am confident that you can greatly benefit in your data science journey by considering one or more of these resources.
- DataCamp: If you are a beginner focused towards building the foundational skills in data science, there is no better platform than DataCamp. Under one membership umbrella, DataCamp gives you access to 335+ data science courses. There is absolutely no other platform that comes anywhere close to this. Hence, if building foundational data science skills is your goal: Click Here to Sign Up For DataCamp Today!
- IBM Data Science Professional Certificate: If you are looking for a data science credential that has strong industry recognition but does not involve too heavy of an effort: Click Here To Enroll Into The IBM Data Science Professional Certificate Program Today! (To learn more: Check out my full review of this certificate program here)
- MITx MicroMasters Program in Data Science: If you are at a more advanced stage in your data science journey and looking to take your skills to the next level, there is no Non-Degree program better than MIT MicroMasters. Click Here To Enroll Into The MIT MicroMasters Program Today! (To learn more: Check out my full review of the MIT MicroMasters program here)
- Roadmap To Becoming a Data Scientist: If you have decided to become a data science professional but not fully sure how to get started: read my article – 6 Proven Ways To Becoming a Data Scientist. In this article, I share my findings from interviewing 100+ data science professionals at top companies (including – Google, Meta, Amazon, etc.) and give you a full roadmap to becoming a data scientist.
Conclusion
A business analyst, or anyone working in business intelligence for that matter, wears many hats. However, while Tableau may not cover every step of data analysis, it does handle data prep and visualization extraordinarily well. Considering that data visualization is the bridge of translation between analysts and those illiterate in data science, comprehension is essential. That is why Tableau’s concise visuals and ease of use make it highly useful to a business analyst.
BEFORE YOU GO: Don’t forget to check out my latest article – 6 Proven Steps To Becoming a Data Scientist [Complete Guide]. We interviewed numerous data science professionals (data scientists, hiring managers, recruiters – you name it) and created this comprehensive guide to help you land that perfect data science job.
Affiliate Disclosure: We participate in several affiliate programs and may be compensated if you make a purchase using our referral link, at no additional cost to you. You can, however, trust the integrity of our recommendation. Affiliate programs exist even for products that we are not recommending. We only choose to recommend you the products that we actually believe in.
Recent Posts
Data science has been a buzzword in recent years, and with the rapid advancements in artificial intelligence (AI) technologies, many wonder if data science as a field will be replaced by AI. As you...
In the world of technology, there's always something new and exciting grabbing our attention. Data science and analytics, in particular, have exploded onto the scene, with many professionals flocking...